Weather Maps
How can weather maps give us different information than a website or app? (Remember, websites and apps can tell us the weather in different parts of the country…)
The best way to not feel hopeless is to get up and do something. Don’t wait for good things to happen to you. If you go out and make some good things happen, you will fill the world with hope, you will fill yourself with hope. BARACK OBAMA
How can weather maps give us different information than a website or app? (Remember, websites and apps can tell us the weather in different parts of the country…)
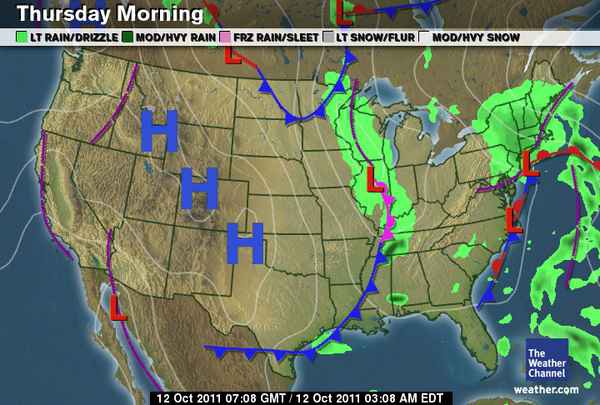
I claim that where the H is that is where the pressure is the highest and where the L is that is where the pressure is the lowest. The lines with the triangles and half circles represent which way a warm or cold front is heading because if its a red line then it will be a warm front but if its a blue line it will be a cold front.
I claim that weather maps can give us more visual information than other sources used to show the weather. My evidence is that a weather map depending on the key can show us the intensity of the weather in an area. A weather map can also show us where a storm may be heading and warn people.
I claim that weather maps can show us a better visual representation of the weather. My evidence is that the key includes very important imformantion. Two symbols that we have learned about is the cold front and warm front symbols. Although they may look the same at first glace they have very different meanings. If you have the symbol for a cold front you can assume that colder and stormier weather will be heading your way and if you have the warm front symbol you can also assume that you will have warmer temperature and moister weather. One other symbol may show us the type of precipritation we will have. For example; if there is a rain cloud over the area you live you know that there will possibly be a rain storm. Another thing we learned about is how high and low pressure is shown on a weather map. An L will stand for low pressure as an H will stand for high pressure. This may not seem important at first but it can affect how cloudy or sunny an area may be. Low pressure tends to go upward meaning the area is cloudier and a high pressure area is the opposite since high pressure tends to go downward meaning there are sunnier skies. Lastly, we learned about Isotherms and Isobars. Isotherms connect the areas with the same (or very similar) temperatures and an Isobar connects the areas with the same atmospheric pressure. Some of these may be on more detailed weather maps more so than simple weather maps but they do matter.
I claim that weather maps can show us a better visual representation of the weather. My evidence is that the key includes very important imformantion. Two symbols that we have learned about is the cold front and warm front symbols. Although they may look the same at first glance they have very different meanings. If you have the symbol for a cold front you can assume that colder and stormier weather will be heading your way and if you have the warm front symbol you can also assume that you will have warmer temperature and moister weather. One other symbol may show us the type of precipitation we will have. For example; if there is a rain cloud over the area you live you know that there will possibly be a rain storm. Another thing we learned about is how high and low pressure is shown on a weather map. An L will stand for low pressure as an H will stand for high pressure. This may not seem important at first but it can affect how cloudy or sunny an area may be. Low pressure tends to go upward meaning the area is cloudier and a high pressure area is the opposite since high pressure tends to go downward meaning there are sunnier skies. Lastly, we learned about Isotherms and Isobars. Isotherms connect the areas with the same (or very similar) temperatures and an Isobar connects the areas with the same atmospheric pressure. Some of these may be on more detailed weather maps more so than simple weather maps but they do matter.
Granted on a website or app you can view multiple parts of the county, but on a weather map, you can see all those areas at the same time. It also provides a visual aid making it easier to understand.
A weather map shows more details then an app or website, atmospheric pressure, cold and warm fronts, isobars and isotherms, and precipitation in certain areas. All of these things are shown on a single map, making it visibly easier to use, and far more efficient by showing you a greater area.
I think that the different information that weather maps can give us are better visuals of where there is precipitation or wind. It also uses colors to represent different types of weather. With weather maps it is easier to see patterns in the weather and climate over a period of time.
I claim that different weather maps can give us information like where warm or cold fronts are, isotherms, isobars, precipitation, and wind. The evidence I have to support my claim is some weather maps are simple and just show temperatures and winds. Other weather maps are more detailed and show information like isotherms and isobars and amounts of pressure.
I think a weather map can show us the direction of a weather events (such as snow, tornados, hurricanes, etc). A weather map also has color coded maps showing different events going on, and has different symbols for different things.
I claim that a weather map can show us many different things like isotherms, isobars, cold fronts, warm fronts, as well as areas of high and low pressure. When we see cold fronts and warm fronts on a weather map we can likely tell what future events (like rain) might happen due to the many factors. My evidence is the weather maps we looked at in class to help us gain a better understanding of them.
Weather maps allow us to see the visual temperature, wind speed, and even different areas. It allows us to see where areas are being affected not just ours, and how they are being affected. Weather maps can also show us the visual affected areas in different countries while other website’s mainly only use numbers, this type of weather system is efficient at helping people plan travel and see travel conditions. It can also help pilots see wind speed and the travel path of wind, this helps make air travel safer. People can also see where area’s will get drizzle, rain, sleet, ice, or hail, which makes road safety easier and helps cities prepare in advance.
I claim that weather maps can help us see visual representation of wind speed and direction, cloud precipitation, and temperature in different regions. My evidence is supported by the multiple experiments and data sheets that we have researched, through this investigation we have researched topic and done experiments to see how different types of weather formations and clouds form and the factors needed for them to form.
In our class we have discussed the different types of fronts, and pressure. We have also plotted and estimated the direction of fronts on a map of the United States, doing these experiments have allowed us to see and understand how different elements form and what their purpose is.
The amount of information given to use by weather maps that show us where fronts are formed, which direction they will head, the areas of high and low pressure, temperature in different regions, wind speed, and precipitation. Using this information, we can predict weather patterns but also help compare it to other weather sources.
The comparison of weather maps to other weather sources is quite dramastic, most weather sources such as newspapers, local news, and weather apps. All of the weather sources including the weather map can include all of the same accurate precipitation of weather, but weather maps tend to use visual rather then just numbers and descriptions. The visual aspect of weather maps can help predict and plan more efficiently than most weather sources can, different types of information given by weather maps such as where fronts are forming, which direction are they heading, and the visual image of pressure can not only help civilians but also researchers in studies.
Weather maps can give us a visual on were a storm may come from. The weather maps can also tell you were certain winds are blowing in a pattern or not. Weather maps are able to show you were hot and cold air might move to.
I claim that weather maps contain the temperature, areas of high and low pressures, the movement of fronts, and were precipitation is expected. My evidence is that on the weather map you can see were each front comes from, the fronts are labeled with an L or an H, the H stands for a cold front which has high pressure, the L is for the warm front which stands for low pressure, because of these different types of fronts you can tell what the temperature could be from watching a warm or cold front. Each of these fronts can also bring precipitation, warm fronts bring good weather, but cold fronts can bring storms, even if a warm and cold front combine they can make storm because of the condensation of water vapor making clouds.
I claim that weather maps give a greater understanding of the weather over a larger area. My reasoning is when a person reads a weather report they tend to only look at the weather in a specific area. The difference is when a person looks at a weather map they can see the path the weather is taking over the whole area.
I claim that weather maps can help us to predict weather and help us see patterns in weather. My reasoning is that on a weather map we can visualize the way the weather is moving much better. In an app, you only see the words, on a weather map it is often animated and moving. It also helps us see patterns as we can see the direction of the fronts and where high and low-pressure systems are located.
Weather maps can give us a visual of where the weather will be surrounding and if they are animated they can tell which way it will be going and when it will be away from your area.
I claim that weather maps give us air pressure and where fronts are coming from. My evidence is that in weather maps they have a specific type of like for warm and cold fronts and they have L’s and H’s to signify low air pressure areas and high pressure areas.
A weather map can you show an area’s weather all at once and where the wind blowing. With a app or website you would have to look up one certain area, a map will show you the whole regions weather that surrounds the area you are looking for. On apps and websites you can know where the wind is blowing but not it’s pattern.
I claim that a weather map can show you an area’s future weather better than a website or app by showing if a air mass is coming its way and/or if the area has a high pressure or low pressure. Apps and websites can you the upcoming weather but a weather map can give you a little more information like the type of weather based on the type of air mass and pressure. Low pressure area can mean a storm because pressure is going in towards the area which means the air can go up and create clouds while with a high pressure area air is leaving the area so clouds can’t form.
Weather maps are good visual aids if you are looking for weather that is gonna come to your area. For example if a big tornado is coming your way a weather map could possibly tell you how fast it’s going and where it is spreading.
I claim that different weather maps can give us a variety of information such as cold or warm fronts, isobars, isotherms, air pressure and the direction or speed of the wind. Depending on what map you look at you can get detailed information like isobars and air pressure or you can just get the temperature and wind speed on simpler maps.
I claim that they show how cold or how warm somewhere is and a cold body of air or a warm body of air. Where it’s going to rain they will show the cold bodies or warm bodies moving up or down the US. And heavy snow light snow.
When using a weather map, you see a visual of what is happening and you can see what is going to happen. When you see it, you won’t misunderstand what you read or hear because you see it, not listen to it. When you read or hear a weather report, you have a chance at misunderstanding or misinterpretation what you hear/read. The downside of using a weather map is that you need to know what the symbols mean. Lucky for us, there is commonly a key, so if you don’t know what something means, look at the key.
I still think that when you are using a weather map, you see what is happening and going to happen, and that you are less likely to misunderstand what you are told/shown. And using a weather map still has the downside of needing to know what the symbols mean. But like I said, there is a key or person that explains what all the symbols mean. However, I now know that weather maps are made by looking at weather in different areas, and calculating the amount of time until the weather will arrive in a certain area, and then putting the collected data into the form of a short animation.
I claim that weather maps can give you different information than a website or app because they show where a cold front or air mass might move or if there is one. A weather map can also tell you where a raincloud might be chilling out. My evidence is that weather maps have visuals while a website or app are most likely lacking in the map department.
I claim that weather maps can give you different information than a website or app because they have a visual of a large area, along with the weather. My evidence is that they show where an air mass is, where it might go, and if it is cold, warm, humid, or dry, the same as they do with large storm clouds. They can tell you where a high or low pressure area is on the map with a blue H or red L. A weather map can give you all this information while a website or app most likely will not.
Because you can tell what’s happening in other places without having to go through a bunch of screens to find it. Weather maps also tell you where it’s going if people don’t know north, east, west, and south. It also tells you the date and time.
I claim that in weather maps you have cold fronts and warm fronts, precipitation, isotherms, isobars, and wind. It can also tell us what kind of weather we will possibly have, like cold fronts and warm fronts crashing together will make weather.
I claim that the difference with weather maps is that they show the weather patterns across the entire country. The weather maps show rain, and snow patterns also they show storms, and were there heading. Weather maps have a visual aspect that sources like websites and apps don’t, they most of the time only show information about the weather like temperature, and wind speeds. they can be more useful for weather in certain ways that weather websites can’t show.
I claim that weather maps and models offer a more easily understandable source of information. They can also provide more information. Instead of simply giving information in written form, they also provide visuals, so as to show multiple differentiating temperatures, wind speeds, or other types of information. they can display what is happening, along with where, in a more comprehensive way. Weather apps lack this feature.
I claim that weather maps gives us different information that all of the other stuff we used, by giving us keys like what we do with graphs we write keys to show us which is which. Weather maps shows us where its gonna snow or rain by making the rain color green and the snow color white or gray.
I claim that weather apps just give us the temperature, wind speed, and the cloud cover. The weather map shows us where the storm is on the map showing us a color like purple, green, or gray and has a H or L to show us the pressure at a spot.
A weather Map can show us everything instead of just one country it can also show what direction the wind is blowing. Weather Maps can also show us what cold or hot air is blowing around in different parts
I claim that a weather map is telling what kind of air is blowing in like a warm front or a cold front. The H’s on the map mean high pressure and the L’s mean low pressure if the two meet they form a cold and warm front.
I think that weather maps are more helpful because if you might not like to read weather reports or if you might not l know what a certain thing means. The maps are also sometimes color coordinated which helps most people understand.
I claim that weather maps are more helpful then websites and apps because most weather websites or apps are boring and they might not show which way the storm is heading but a weather map might show were the a storm is heading. I also have seen a weather map. You also have to know what the difference between a cold and warm front. You might also have to know what happens when a cold and warm front clash.
I claim the difference between the website and a weather map is the weather map has different symbols and tells up the highs and lows for maybe in a certain spot on the map. The weather map also tells us if there will be a storm.
I claim that maps can give us better information because they show where the high and low pressure is heading. They also show where the warm and cold fronts are heading. For apps and online the don’t really show pictures they show the temp, cloud cover, and precipitation. My evidence is what we did in our notebooks and on the internet.
I claim weather maps identify the wind direction, if it hot or cold, they show where the type of weather is going to happen and where it is going to happen. weather maps also tell us the whole weather for the whole country where and when it is going to happen.
I claim that weather maps show the high and low pressure and were it is happening. In the areas of highest pressure the weather is fair. In the areas of low pressure the clouds get pushed up causing rain clouds which causes precipitation. It also shows lines that show which direction the clouds are heading in and what type of pressure is going to happen
I claim weather maps show you pretty much the whole area including temperatures, wind, or what is going on in that giving time. In apps it doesn’t give you visuals sometimes, just information about the weather.
I claim weather maps can show you what it is like in your area at that time and also a couple days into the future. Weather maps include information about, wind speed, temperature, precipitation, high and low pressure. My evidence is on the news they provide you with a map showing you the area you live in, they also go in depth what it may look like ahead of time which apps don’t do.
Weather maps can provide us with information about different areas and what is about to happen and what the temperature will be like. Apps can be helpful, but they are not always the best, Detailed weather maps are helpful because they can show you distances of certain storms and the measure of pressure and temperature, some apps don’t do that! Weather maps can also show wind direction and different air masses . Weather maps are incredible!
I claim that unlike a website or app a wether can tell us where the wind is blowing from, what the pressure is and how far out you would have to go to avoid this weather as well as giving an accurate representation visually and this can make it easier to understand for some people. I also think that weather maps go more in depth by adding certain lines that are colored to represent whatever is linked in the map key. And none If not most apps and websites do not show what kind of temperature mass is coming from where and if it will create a front.
I claim that wether maps differ from websites in information because they can show a specific selection of information and provide visual aid that displays cold/warm fronts. This factor tends to make wether maps more understandable and a more trust worthy source of information.
I claim that a weather map contains if there is a cold front moving in or a warm front moving in.The way how you tell if a warm front is moving in is by there are lines that could go across the whole map and the warm fronts have more of a rounded point and then a cold front have more of a shaper point like a triangle. A weather map also contains of things called and isotherm. In a weather map and isotherm is used to measure temperature and the isotherm symbols are like little tiny squiggly lines on the map. On most maps That i have seen they are mostly blue.
claim that if you use a weather map that you see or one that on the news you will get more information out of the map then just looking on your app in your phone. Using a app mite just give you the tempchar or let you no what its going to be like, but when you look at a map it’s going to tell you all that stuff and more. Like the map will tell you if a warm front or a cold front is coming in. My evidence is that I have seen it on the news like that.
I claim that weather maps can give us more information then a website or weather app. My evidence is that i have seen weather maps that show high and low pressure, wind speed, temperature, warm and cold fronts, isotherm, isobar, and rain and snow.
I claim that weather maps are more detailed than apps because apps don’t tell you if a cold or warm fronts is approaching. Cold fronts are areas of cold air that collides with a warm front that typically causes precipitation, either snow or rain. Warm fronts usually cause mild precipitation, sunny weather and clouds. Apps can’t tell you about air pressure or isobars both of which are related to pressure. Nor can apps or websites tell you the wind direction.
I claim that weather maps can show more visuals than an app that just gives you information than the visuals. My evidence is on a weather map it can show the direction and showing where the storm or different kinds of weather are heading to. An app has less space to put visuals in, like what the weather looks like or the app may show you the background of what it looks like in your area. Some apps and weather maps can tell you the weather in other places, for example if you were wondering about the temperature for the olympics in South Korea you can find an app or website that can show you the weather for the olympics.
It could show you where the wind is blowing the hardest and the softest, which direction its going, the highs and lows in temperature around the world, and where the clouds are the densest.